If you have a website and you’re promoting it, you need to start tracking your stats. If you don’t, you have no idea if you are doing things right or not. You don’t know what campaigns are working, which ones aren’t and you don’t have a clue as of why people aren’t buying from you as much as you’d like them to.
Google Analytics is a great tracking tool. The best free one in my opinion. What I love about Google Analytics is that you can get very advanced segmented reports if you are a pro, but you can also get very basic reports that anybody can understand.
The way I use Google Analytics revolves around conversion rates. There are many metrics that I care about, but conversion rate is always first. Why? Well, a conversion is your ultimate goal and if you understand what kind of traffic converts, then you can focus on that segment and get more of it.
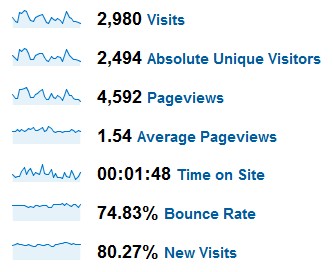
 Let’s take a look at the stats of one of our clients. Visits is the total number of visits a website gets. Unique Visitors, on the other hand, is the number of people that visit your site. If one person visits your site 4 times, that is accounted as 4 visits and 1 unique visitor.
Page views is the total number of pages viewed by all your visitors.
Time on site is pretty self-explanatory.
Bounce rate is the percentage of visitors that leave your website right after they arrived. In the case of this client the bounce rate is high because most people go to their site to read one piece of content. Although a high bounce rate is usually bad, it not always is.
New Visits refers to the percentage of visitors that are on your site for the first time.
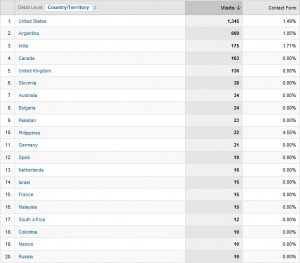
If you click on Map Overlay and then Conversion Rate you will see a screen like this one.
 In this chart we can see that the conversion rate is 1.49% for the US and 0% for Canada. The funny thing is that the CEO of this company called me last week and he told me that he thought that his products would sell really well in Canada. After I showed him this, he changed his mind.
Stats are a great way to stay informed and make smart decisions. If you get a lot of information and you don’t do anything with it, you might as well not get the information.
Now, let’s take a look at new and returning visitors.
 We can see how returning visitors covert twice as much as new visitors. This helped us decide that we wanted to start a new blog on the site to keep people engaged and coming as often as possible. Remember, it’s not the data that counts, it’s what you do with it.
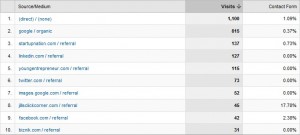
Let’s take a look at one of my favorite reports: Traffic Sources.
 We can see that direct traffic converts fairly well -for this industry is actually a great conversion rate. Google’s organic traffic is decent (0.37%). StartupNation.com is a lot better and LinkedIn and YoungEntrepreneur.com are converting at a 0% rate. The conversion rate for LinkedIn the previous month was 2% and now it’s 0%. Last month we decided to change the kind of articles we were publishing for this client. Now we know it wasn’t such a good idea and we are going back to the original topics. Are you starting to see how powerful this could be?
Another report I really like is the keyword report. In this report you can see what keywords convert well and what keywords convert poorly. That way you can figure out what kind of search queries bring you money and you can optimize your site for those keywords. I also spend some time looking at the most viewed content to get an idea of the kind of content that attracts people so we can create more of it.
Remember: learn from your traffic and give your visitors what they want. Discover your most profitable segments; then work on getting more out of them.


